Automating Data Storytelling: SDMX Data Visualization using GenAI
George Verouchis
In this article, we explore an innovative approach to statistical data visualization and storytelling using OpenAI’s GPT-4 model on Microsoft’s Azure Cloud platform. We’ll demonstrate how to transform complex SDMX datasets into compelling visual narratives through an intelligent multi-agent system. From automated data retrieval to sophisticated visualization and natural language storytelling, we’ll show how GenAI is revolutionizing the way we interact with and understand statistical data. Whether you’re a data scientist, statistician, or policy maker working with statistical data, this guide offers practical insights into building data visualizations seamlessly.
Beyond Numbers: The GenAI Revolution
In today’s data-driven world, statistical information plays a crucial role in decision-making across organizations. However, there’s often a gap between raw statistical data and meaningful insights that can drive action. Traditional approaches to data visualization and interpretation can be time-consuming and may not fully capture the narrative potential within the data. The emergence of powerful foundation GenAI models like OpenAI’s GPT-4 opens new possibilities for automating and enhancing this process.
Consider this scenario: You have access to vast amounts of socio-economic data in SDMX format from sources like the European Central Bank or Eurostat. While this data is invaluable, transforming it into actionable insights traditionally requires significant manual effort — from data retrieval and processing to visualization and interpretation. What if AI could streamline this entire process, automatically generating not just visualizations but also providing meaningful context and narrative?
“In a world drowning in statistical data, GenAI can become our digital data interpreter, turning complex datasets into compelling stories that anyone can understand.”
Our solution combines three key elements:
- Automated data retrieval and processing from SDMX sources
- Intelligent visualization selection and generation
- AI-driven narrative generation for context and insights
The timing for this approach couldn’t be better. At recent industry conferences, major financial institutions have demonstrated remarkable progress in integrating AI with statistical data. The IMF’s StatGPT initiative has already shown promising results. The Bank for International Settlements is investing heavily in GenAI solutions for SDMX applications, while the OECD is pioneering AI-driven approaches for dataset onboarding. These developments signal a clear direction: the future of statistical data analysis lies in intelligent automation and natural language processing.
Following this industry momentum, we’ll walk you through the implementation of a real-world example using Eurostat’s full-time employment data. We’ll transform raw statistical data about average salaries across Europe into an engaging visual narrative that reveals meaningful patterns and insights.
The Plan
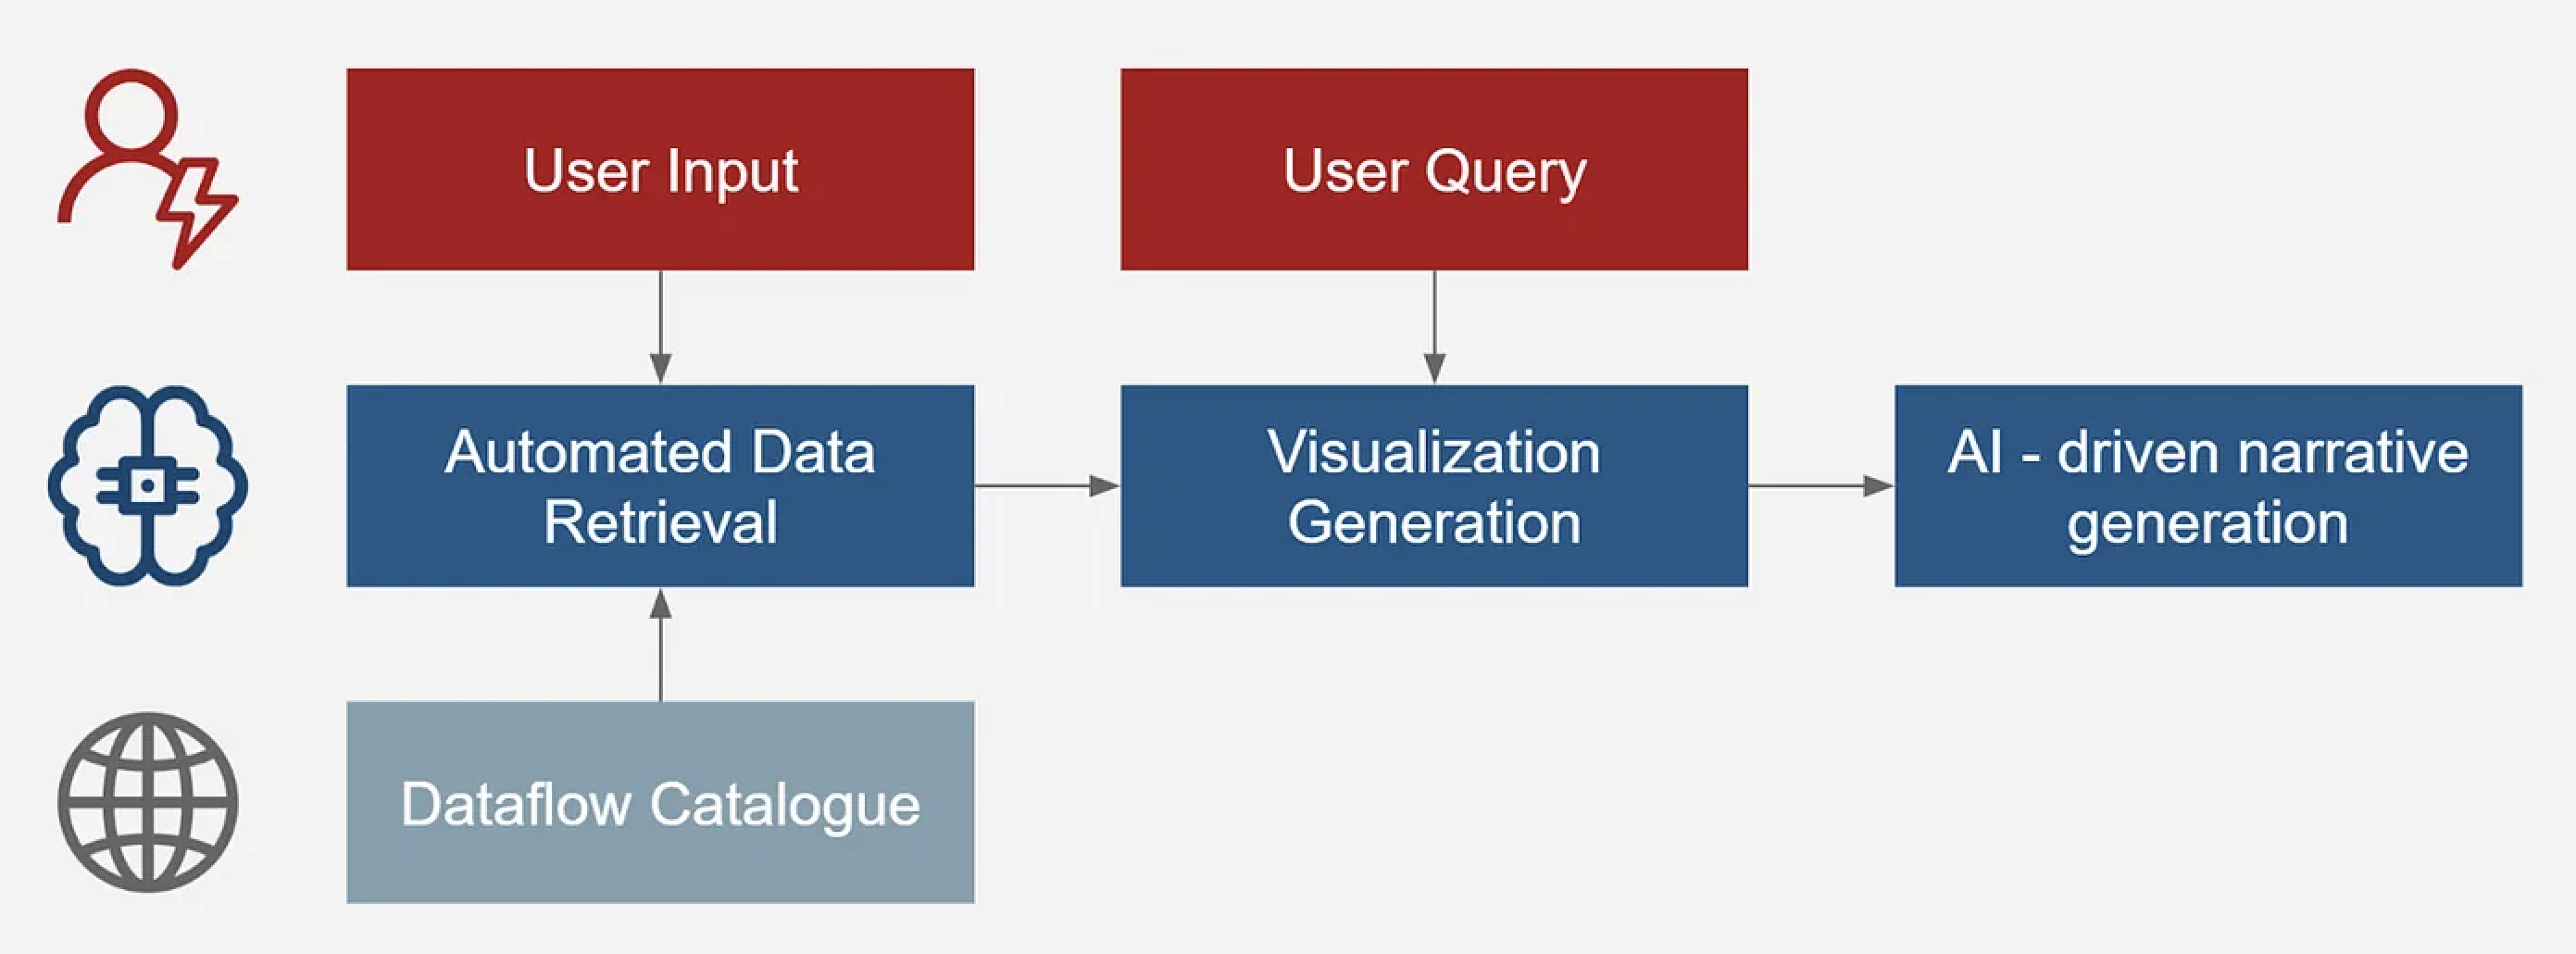
Our technical implementation leverages SDMX datasets, provided by Eurostat, to demonstrate GenAI-driven data visualization and storytelling. Using Microsoft’s Azure platform, we deploy a multi-agent system built around OpenAI’s foundation model GPT-4. The workflow starts with Automated Data Retrieval and preprocessing, where raw SDMX data derived from a specific agency’s Dataflow Catalogue is transformed into a structured format. A User Input is used to describe in natural language what dataset we want and the model identifies the correct dataset ID within the Catalogue. Then, a User Query is used to do a request of a specific type of visual or chart. GPT-4 dynamically generates Python code that filters, processes, and creates the requested Data Visualizations. Finally, the model analyzes the chart and generates a natural language narrative, summarizing key insights, trends, and comparisons visible in the graph. This automated pipeline can transform statistical data into accessible visual and textual stories, offering a seamless experience from raw data to actionable insights.
Setting Up the Environment
First, let’s set up our AI workspace. We’ll use Python and Azure OpenAI to create an AI-powered data processing workflow. We’ll configure the environment to use GPT-4, with secure API key management for Azure services.
API_KEY = "your-api-key" # Set your Azure API Key
DEPLOYMENT_NAME = "your-deployment-name" # Your GPT-4 deployment name
API_VERSION = "2024-08-01-preview"
ENDPOINT = f"https://your-resource.openai.a...{DEPLOYMENT_NAME}/chat/completions?api-version={API_VERSION}"
HEADERS = {
"Content-Type": "application/json","api-key": API_KEY,}
results = []
for pv_info in info:
if "pv" not in pv_info or "score" not in pv_info:
continue
pv = pv_info["pv"]            if not pv:                continue                        score =
pv_info["score"].relative.score(mate_score=100000) / 100                        first_move = pv[0]            board_copy =
board.copy()            move_san = board_copy.san(first_move)
API_KEY = "your-api-key" # Set your Azure API Key
DEPLOYMENT_NAME = "your-deployment-name" # Your GPT-4 deployment name
API_VERSION = "2024-08-01-preview"
ENDPOINT = f"https://your-resource.openai.a...{DEPLOYMENT_NAME}/chat/completions?api-version={API_VERSION}"
HEADERS = {
   "Content-Type": "application/json",
   "api-key": API_KEY,
}
helloworld
class ChessAnalyzer:    def __init__(self, stockfish_path="stockfish"):        """Initialize the chess analyzer with path to Stockfish engine."""        self.engine = chess.engine.SimpleEngine.popen_uci(stockfish_path)            def analyze_position(self, fen, depth=20, multipv=3):        """        Analyze a chess position given in FEN notation.        Returns moves with scores adjusted by the standard deviation of follow-up positions.        """        try:            board = chess.Board(fen)        except ValueError as e:            return f"Invalid FEN notation: {e}"
m = folium.Map(location=[47.36667, 8.55], zoom_start=12)
# Convert LV95 to WGS84
noisy_relis_street = pop_street_stats_gdf[
   pop_street_stats_gdf['street_noise'] >= 77
].to_crs(epsg=4326)
# Plot each row's noise level as a dot
for _, r in noisy_relis_street.iterrows():
   geo_j = gpd.GeoSeries(r['geometry']).to_json()
   geo_j = folium.GeoJson(data=geo_j,
                          style_function=lambda x: {'color': '#ab121a'})
   geo_j.add_to(m)
m